How to View Group Usage Statistics
Go to Console -> Statistics -> Room Usage
Open Statistics -> Room Usage to monitor, in real time, how the computers in each classroom (group) are being used.
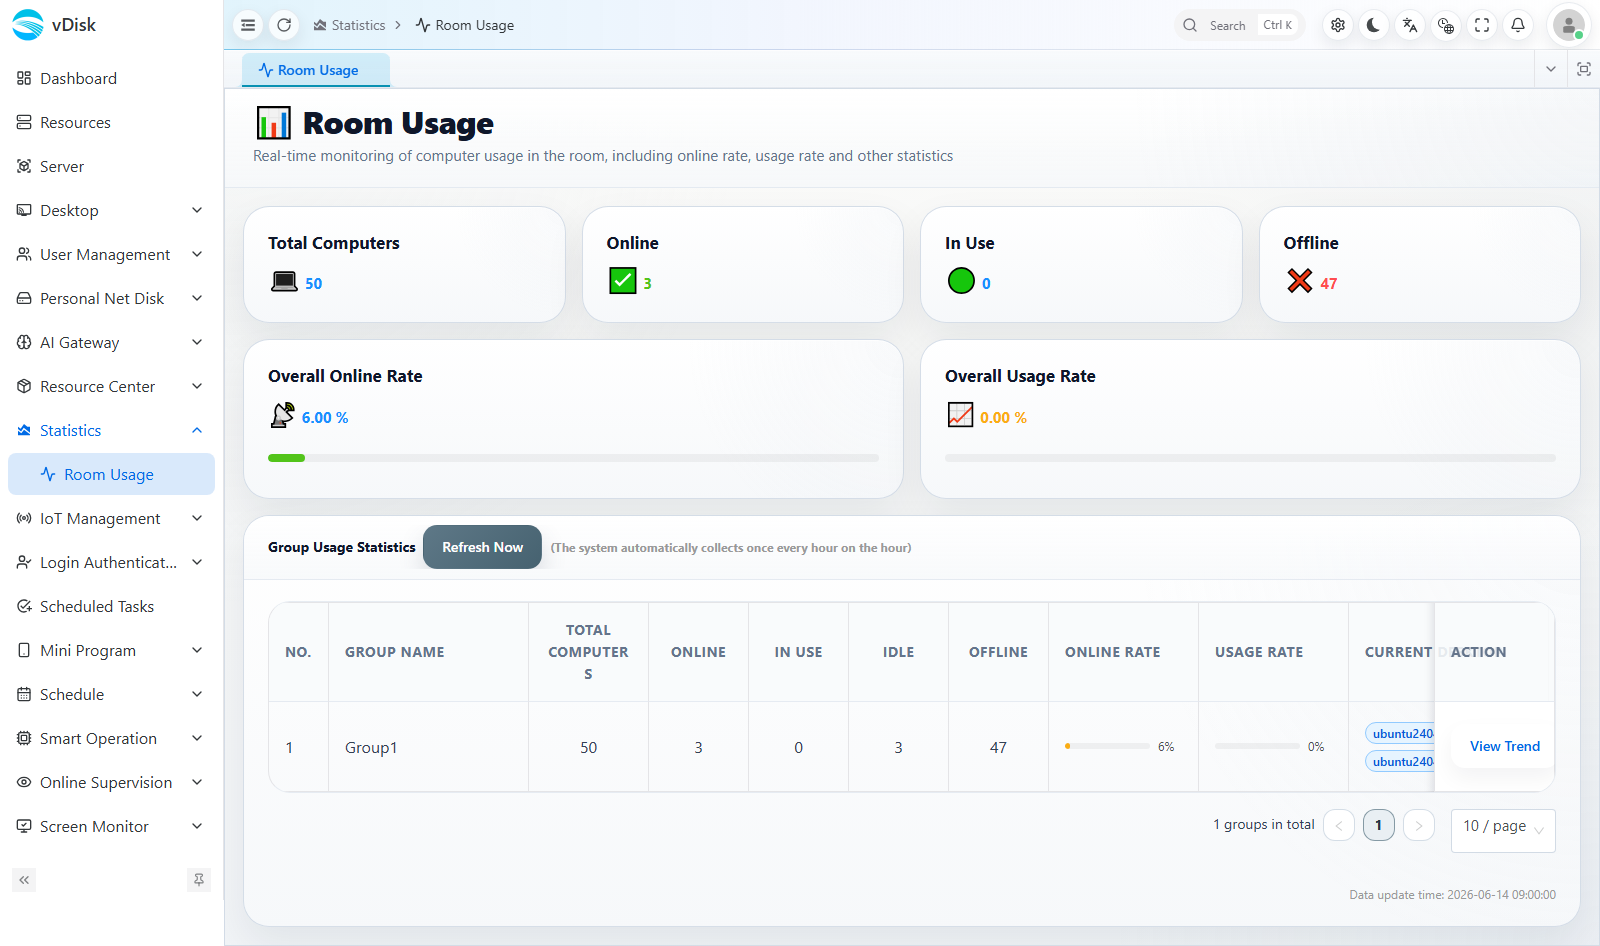
Top Summary Metrics
Cards at the top of the page summarize the overall figures across all classrooms:
| Metric | Description |
|---|---|
| Total Computers | Total number of computers included in the statistics |
| Online | Computers currently powered on and online |
| In Use | Computers currently being used by someone |
| Offline | Computers currently powered off or offline |
| Overall Online Rate | Online / Total as a percentage |
| Overall Usage Rate | In Use / Total as a percentage |
Group Detail List
The Group Usage Statistics table below lists each group row by row. Click Refresh Now to fetch the latest data:
| Column | Description |
|---|---|
| Group Name | Classroom / group name |
| Total Computers | Total computers in the group |
| Online / In Use / Idle / Offline | Number of computers in each state |
| Online Rate / Usage Rate | Online and usage percentages for the group |
| Current Desktop | Desktop image currently delivered to the group |
| CPU Temp | CPU temperature range of computers in the group |
| Action | Click View Trend to see how the online / usage rate changes over time |
Statistics cover the online, in-use, idle and offline states of every computer in the group.
The CPU temperature range helps spot machines with cooling problems early.
Click "View Trend" to review the usage trend over time and assess how well a classroom is utilized.